Introduction
Evaluating cloud S3 object storage goes far beyond peak throughput. Real-world performance depends on how a provider handles concurrent uploads, varying object sizes, and operational tasks like metadata retrieval and deleting objects. This report breaks down each workload separately to show exactly where IDrive® e2 excels and where performance shifts based on the operation.
Key Findings
- IDrive® e2 recorded the highest data transfer rates across all 12 PUT workload configurations tested. Throughput scaled proportionally with increased concurrency, reaching a maximum recorded speed of 1,879.48 MiB/s at 10 threads when processing 100MiB objects.
- In data retrieval testing, IDrive® e2 led in 9 of the 12 evaluated GET categories, achieving a peak throughput of 1,034.81 MiB/s under 10-thread workloads. Backblaze B2 demonstrated higher throughput in specific lower-concurrency configurations, noting an advantage in 1-thread (5MiB, 50MiB) and 5-thread (5MiB) workloads.
- During service-side request processing evaluations, IDrive® e2 recorded an average HEAD latency of 9.8 ms. For inventory management tasks, the service processed LIST operations at a rate of 71,467.78 objects per second, with a Time to First Byte (TTFB) recorded at 14 ms.
- For DELETE operations, IDrive® e2 processed 3,475.88 objects per second, with an average request latency of 290.43 ms.
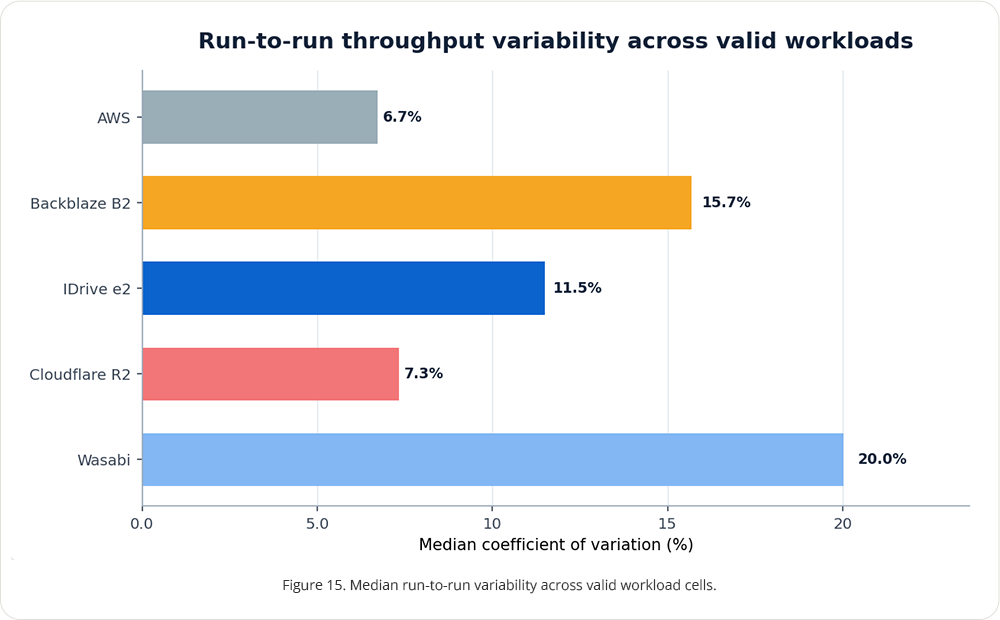
- In measuring run-to-run consistency, AWS S3 demonstrated the lowest variance among tested providers with a Coefficient of Variation (CV) of 6.7%. Cloudflare R2 recorded a 7.3% CV, while IDrive® e2 operated with an 11.5% CV across the standardized testing cycles.
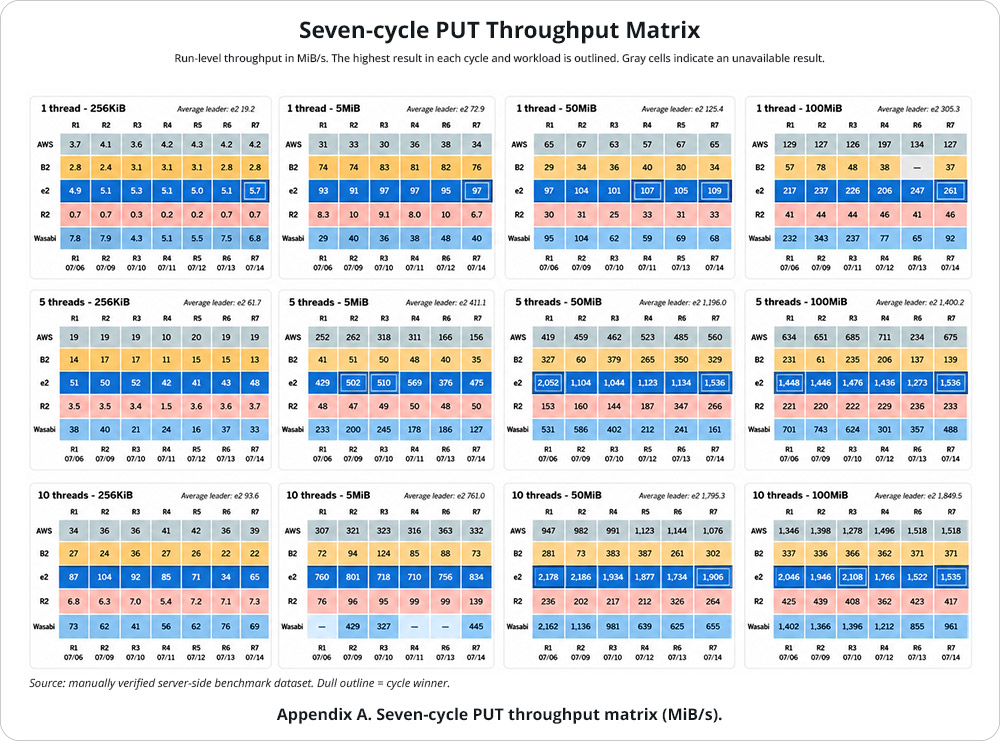
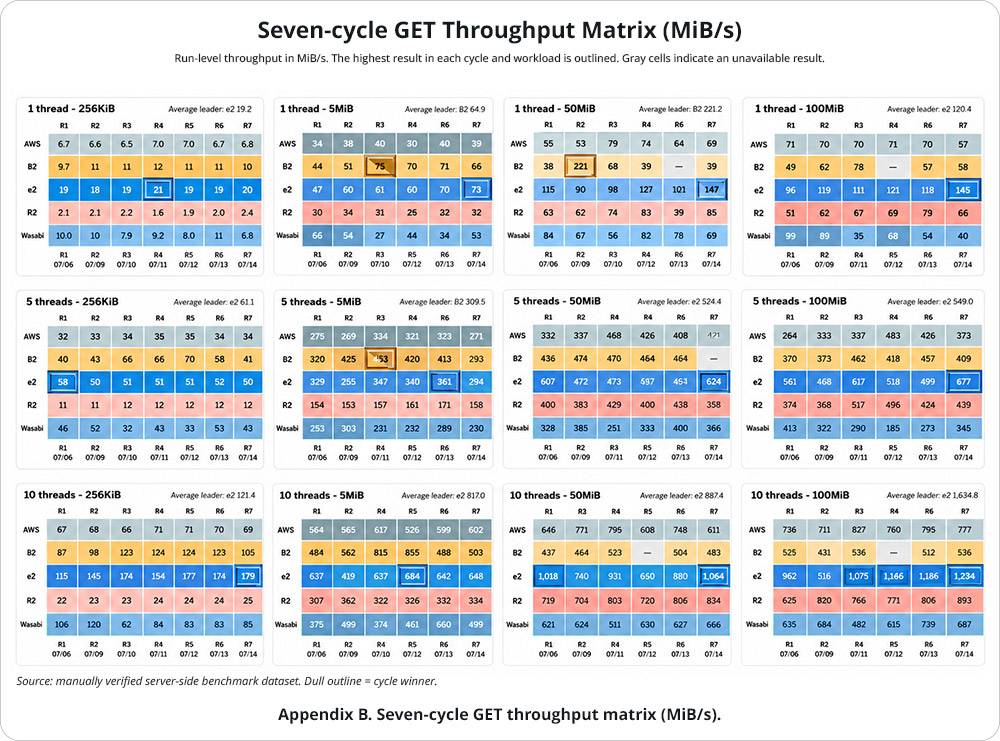
- Charts use the same color scheme for all providers, with IDrive® e2 shown in royal blue. All seven-cycle PUT/GET figures and tables are based on the manually verified benchmark dataset.
Test Bed and Workload
All providers were tested from the same Vultr Linux virtual machine in US East using Warp. PUT and GET testing covered four object sizes and three concurrency levels over seven dated cycles. LIST and DELETE were executed separately as a one-day operational benchmark using 100,000 objects, 256KiB object size, and 10 concurrent workers.
Testing from a single origin helps reduce variation from different hardware or regions, but it means these results reflect only the US East path. Provider endpoints, routing, peering, and service regions can vary. The following figures summarize the test path and the consistent dimensions used for all providers.
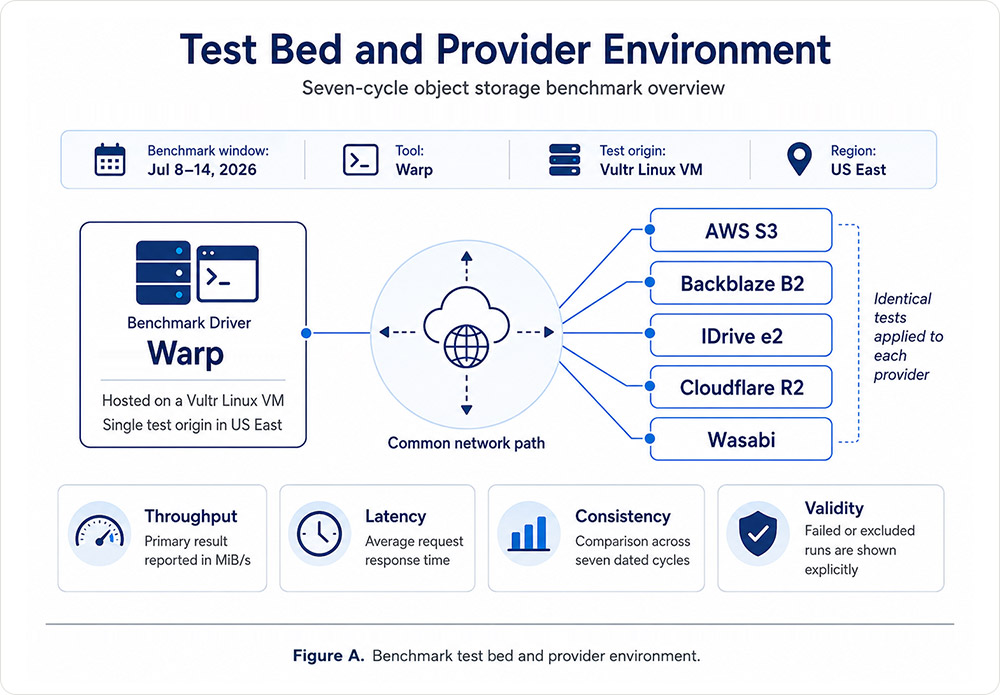
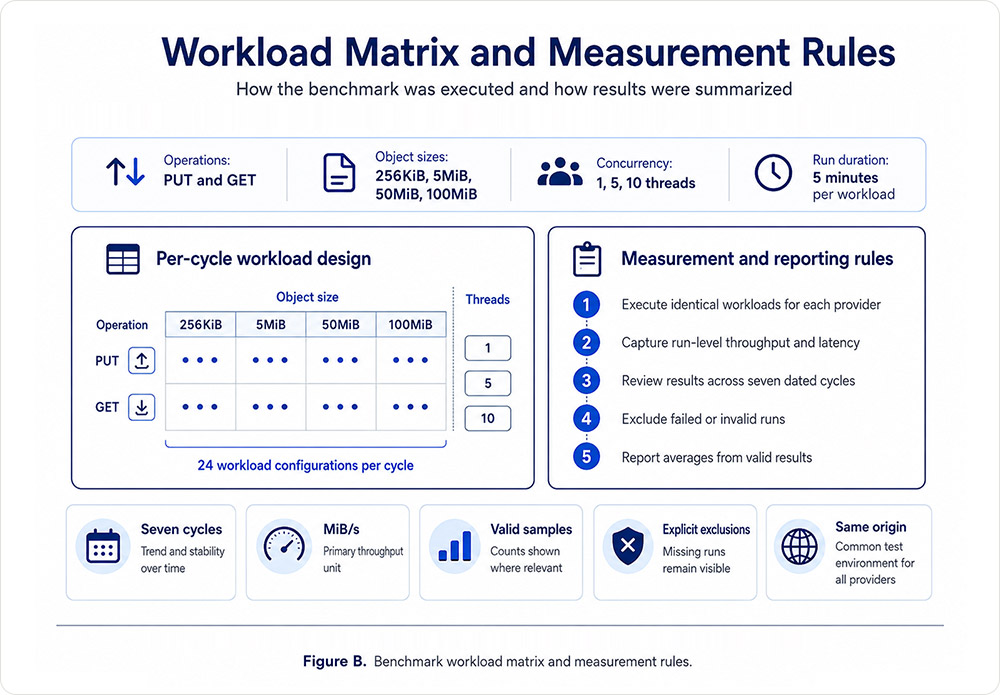
The workload visualization above applies to the seven-cycle PUT and GET benchmark. LIST and DELETE are documented separately in Section 7 because their execution model and observation window differ.
The following sections explain each test category in more detail.
Upload (PUT) Performance
Download (GET) Performance
1. Upload (PUT) Performance
PUT measures sustained upload throughput in MiB/s. The following sections separate sequential behavior from concurrent scaling and show valid sample counts alongside averages.
1.1 1-Thread PUT Throughput
| Object size | AWS | Backblaze B2 | IDrive® e2 | Cloudflare R2 | Wasabi |
|---|---|---|---|---|---|
| 256KiB | 4.03 | 2.80 | 9.37 | 0.69 | 6.50 |
| 5MiB | 34.94 | 8.30 | 72.91 | 9.64 | 39.15 |
| 50MiB | 85.59 | 25.50 | 215.43 | 30.63 | 80.53 |
| 100MiB | 124.43 | 34.59 | 307.30 | 43.93 | 103.29 |
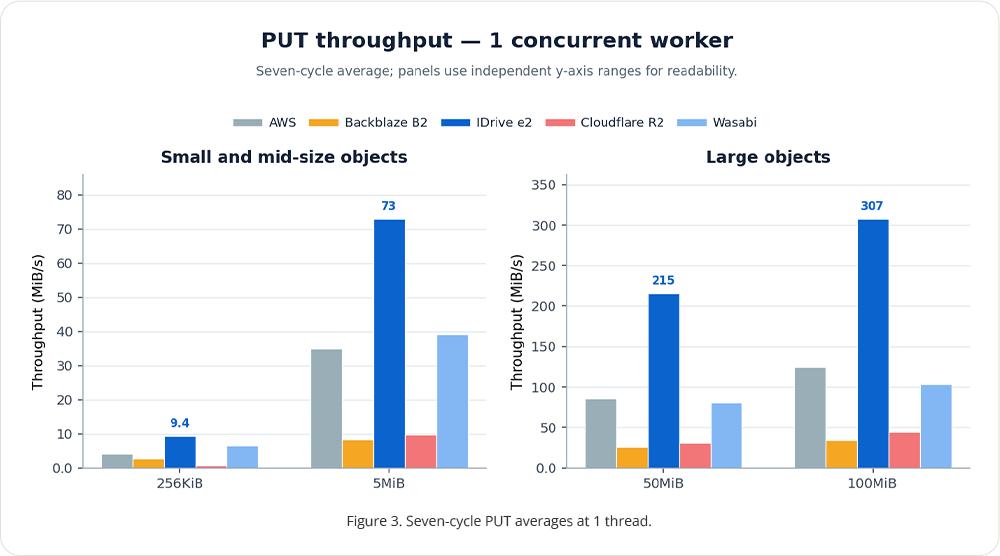
IDrive® e2 led all four object-size categories at 1 thread. Its average ranged from 9.37 MiB/s at 256 KiB to 307.30 MiB/s at 100 MiB.
1.2 5-Thread PUT Throughput
| Object size | AWS | Backblaze B2 | IDrive® e2 | Cloudflare R2 | Wasabi |
|---|---|---|---|---|---|
| 256KiB | 19.30 | 14.64 | 47.71 | 3.54 | 30.34 |
| 5MiB | 164.63 | 42.55 | 418.12 | 48.80 | 184.54 |
| 50MiB | 479.67 | 134.85 | 1,136.00 | 157.45 | 372.71 |
| 100MiB | 681.09 | 175.01 | 1,400.18 | 219.27 | 517.81 |
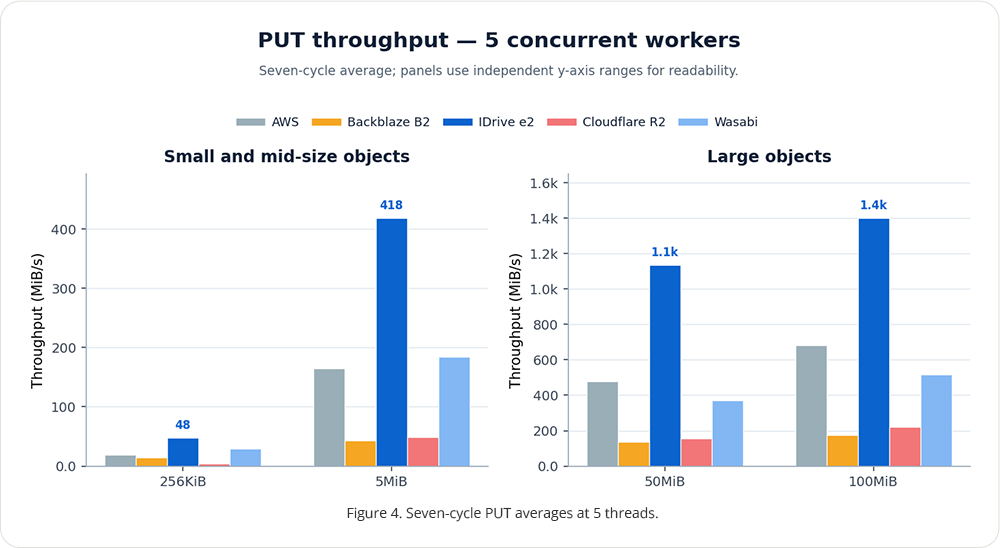
IDrive® e2 led all four object-size categories at 5 threads. Its average ranged from 47.71 MiB/s at 256KiB to 1,400.18 MiB/s at 100MiB.
Five-thread testing represents a moderate level of client-side parallelism and may be relevant to backup, synchronization, and migration applications that use several simultaneous transfers.
The rankings seen with one thread remained the same as concurrency increased. This means the top performer handled more simultaneous uploads across all object sizes, not just single transfers.
1.3 10-Thread PUT Throughput
| Object size | AWS | Backblaze B2 | IDrive® e2 | Cloudflare R2 | Wasabi |
|---|---|---|---|---|---|
| 256KiB | 38.60 | 26.79 | 93.00 | 6.82 | 63.94 |
| 5MiB | 341.31 | 82.91 | 783.96 | 97.96 | 400.30 |
| 50MiB | 1,050.94 | 178.92 | 1,739.53 | 298.89 | 910.76 |
| 100MiB | 1,432.63 | 354.15 | 1,879.48 | 409.76 | 1,147.76 |
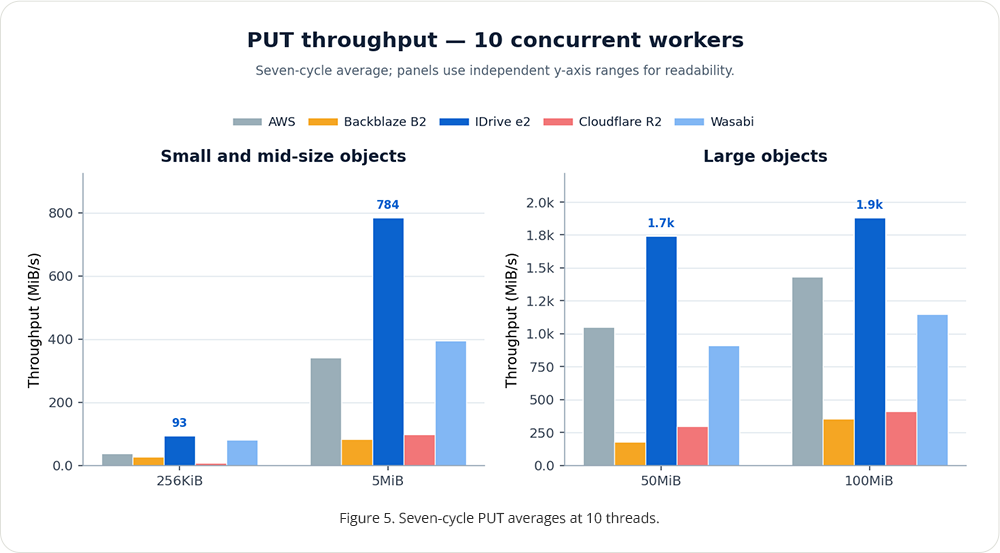
IDrive® e2 led all four object-size categories at 10 threads. Its average ranged from 93.00 MiB/s at 256 KiB to 1,879.48 MiB/s at 100 MiB.
The ten-thread results are the strongest indication of aggregate upload capacity in this test matrix. Large-object PUT throughput rose substantially across all providers, but the extent of scaling varied. These values are most relevant to parallel backup, replication, migration, and media-ingest workflows that maintain several active uploads rather than waiting for one object to complete before sending the next.
1.4 PUT Concurrency Scaling
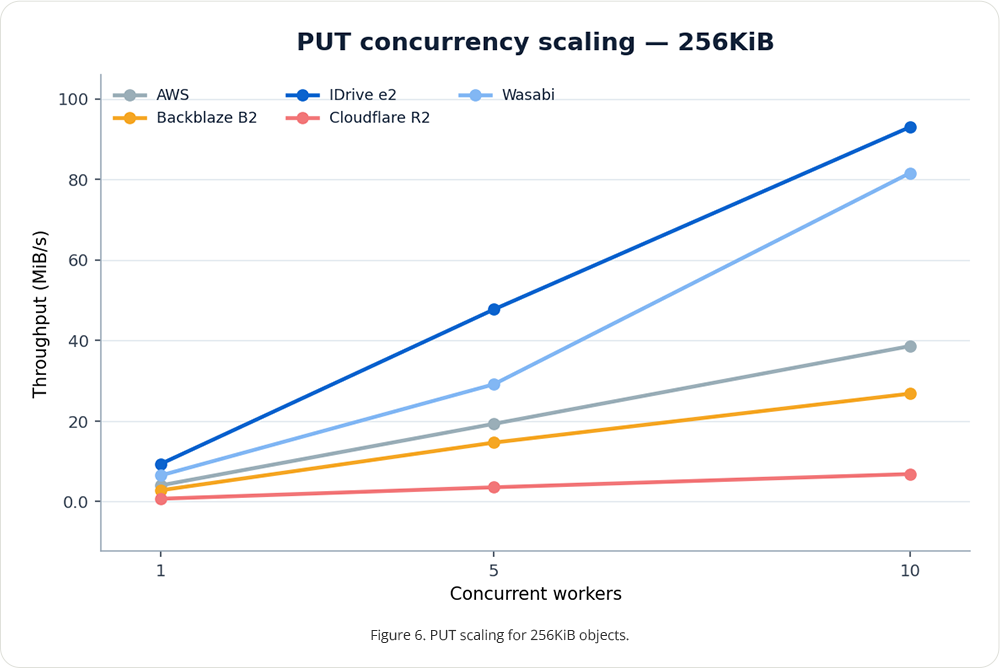
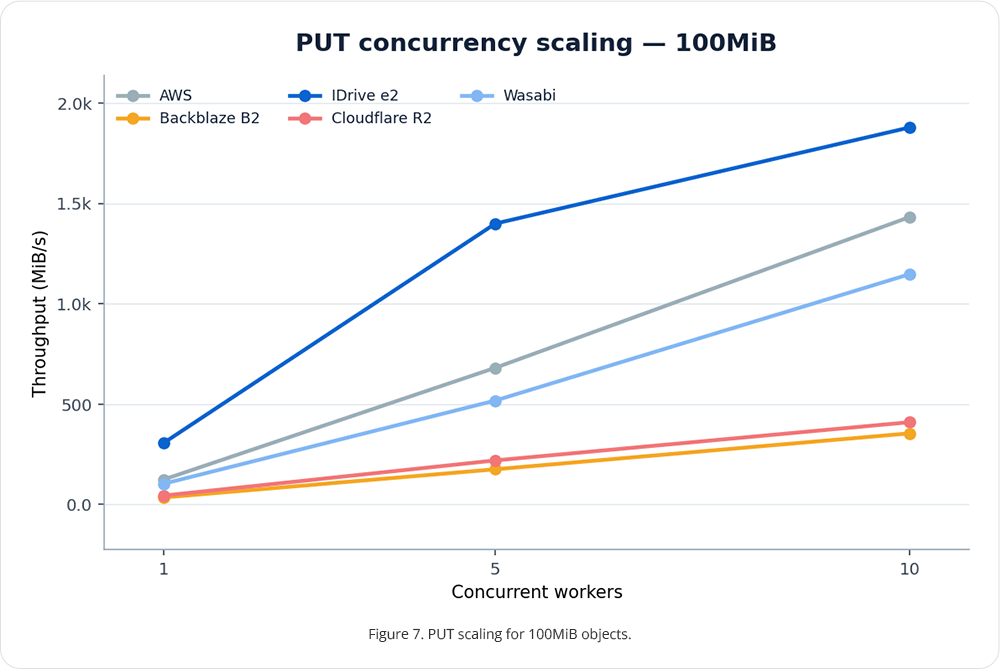
The scaling curves show whether throughput rises as more workers are added, from one to 10. Larger objects usually see bigger gains because connection and request overhead matter less. For small objects, scaling depends mostly on request-processing overhead, while for 100MiB objects, it reflects sustained transfer speed and how well concurrent streams are used.
2. Download (GET) Performance
GET measures how much data can be downloaded over time, in MiB/s. Compared to PUT, single-threaded GET is more similar across providers, but differences become clearer when more threads are used.
2.1 1-Thread GET Throughput
| Object size | AWS | Backblaze B2 | IDrive® e2 | Cloudflare R2 | Wasabi |
|---|---|---|---|---|---|
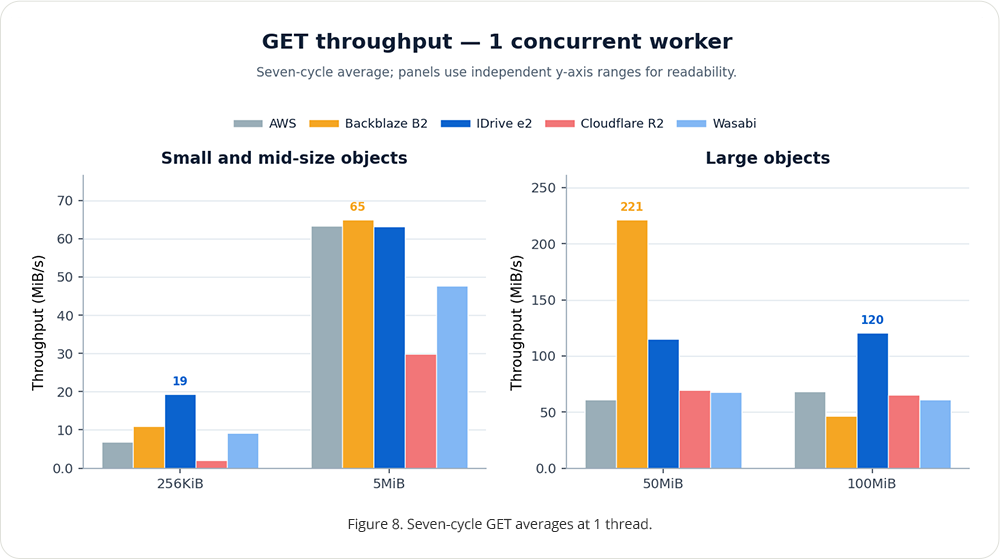
| 256KiB | 6.86 | 11.04 | 19.24 | 2.05 | 9.21 |
| 5MiB | 63.36 | 64.87 | 63.13 | 29.88 | 47.59 |
| 50MiB | 60.87 | 221.20 | 114.81 | 69.62 | 67.78 |
| 256KiB | 68.29 | 46.70 | 120.40 | 65.48 | 61.05 |
Category leaders: 256KiB: IDrive® e2, 5MiB: Backblaze B2; 50MiB: Backblaze B2; 100MiB: IDrive®e2.
Single-thread GET was the most competitive part of the test. Backblaze B2 led in the 5MiB and 50MiB categories, while IDrive® e2 led in 256KiB and 100MiB. The 5MiB results were close: Backblaze B2 averaged 64.87 MiB/s, AWS S3 63.36 MiB/s, and IDrive® e2 63.13 MiB/s.
2.2 5-Thread GET Throughput
| Object size | AWS | Backblaze B2 | IDrive® e2 | Cloudflare R2 | Wasabi |
|---|---|---|---|---|---|
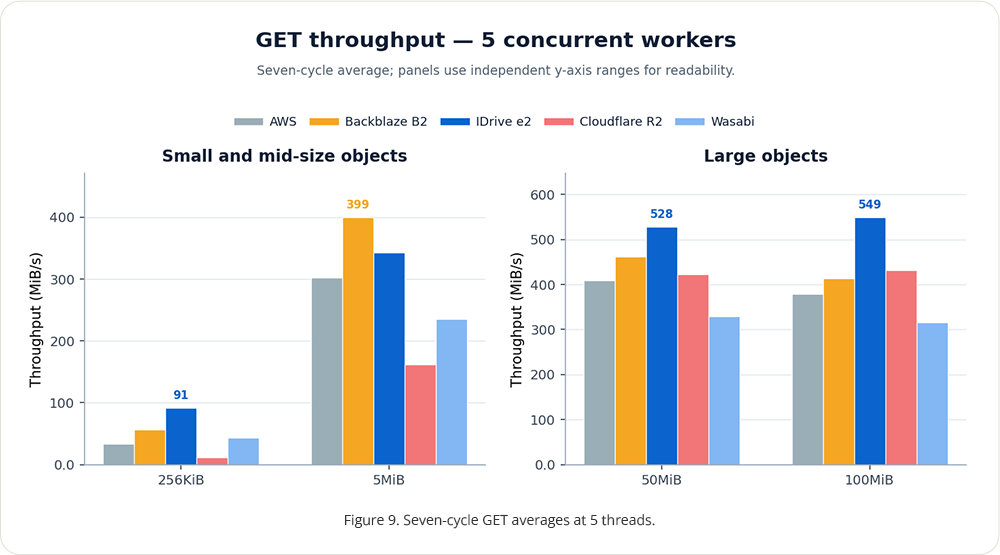
| 256KiB | 33.95 | 56.41 | 91.09 | 11.73 | 42.82 |
| 5MiB | 302.32 | 399.49 | 343.10 | 161.32 | 235.83 |
| 50MiB | 409.83 | 462.69 | 528.40 | 423.51 | 328.61 |
| 100MiB | 378.34 | 414.12 | 548.89 | 431.28 | 315.88 |
Category leaders: 100MiB: IDrive® e2, 256KiB: IDrive® e2, 50MiB: IDrive® e2, 5MiB: Backblaze B2.
With five threads, Backblaze B2 led the 5MiB GET at 399.49 MiB/s, while IDrive® e2 led in 256KiB, 50MiB, and 100MiB. These mixed results show why it’s important to compare the workload category that matches your application.
2.3 10-Thread GET Throughput
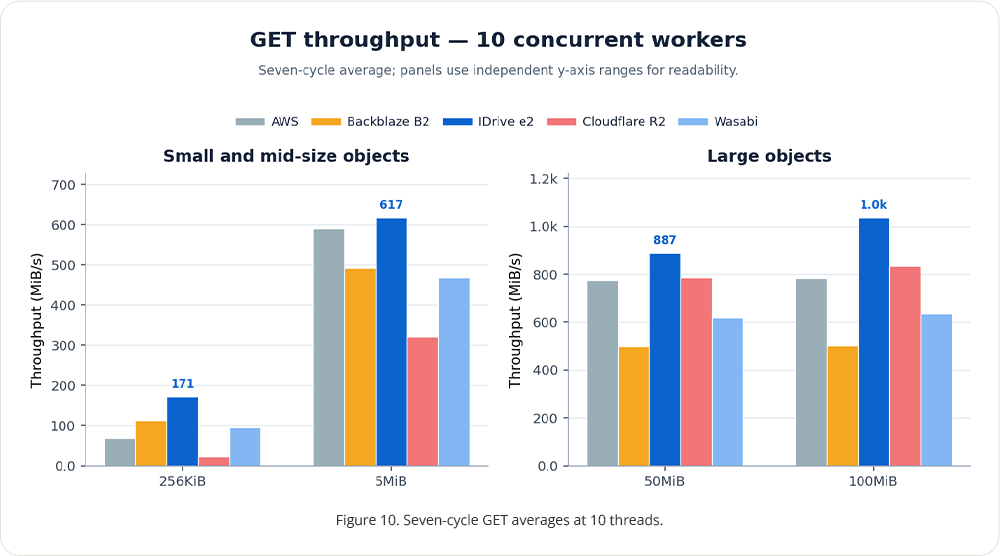
| Object size | AWS | Backblaze B2 | IDrive® e2 | Cloudflare R2 | Wasabi |
|---|---|---|---|---|---|
| 256KiB | 68.70 | 112.31 | 171.43 | 23.62 | 95.45 |
| 5MiB | 590.31 | 492.69 | 617.02 | 321.25 | 467.69 |
| 50MiB | 773.96 | 500.04 | 887.35 | 787.01 | 617.71 |
| 100MiB | 783.22 | 500.82 | 1,034.81 | 832.94 | 633.86 |
Category leaders: 100MiB: IDrive® e2, 256KiB: IDrive® e2, 50MiB: IDrive® e2, 5MiB: IDrive® e2.
With ten threads, IDrive® e2 led all four GET size categories, from 171.43 MiB/s at 256KiB up to 1,034.81 MiB/s at 100MiB. This shows its advantage grew as concurrency increased.
2.4 GET Concurrency Scaling
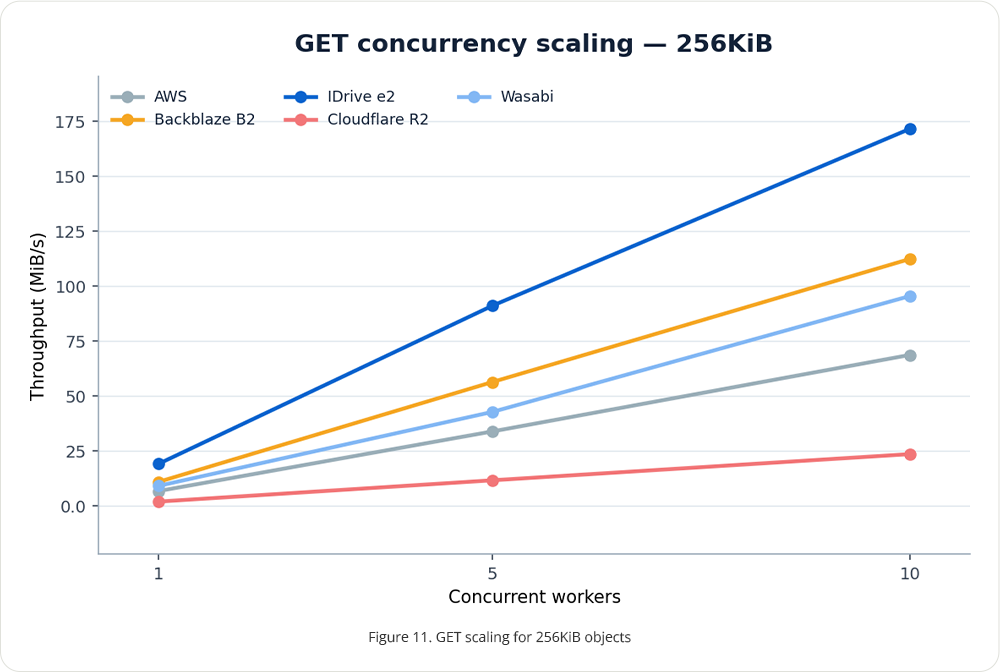
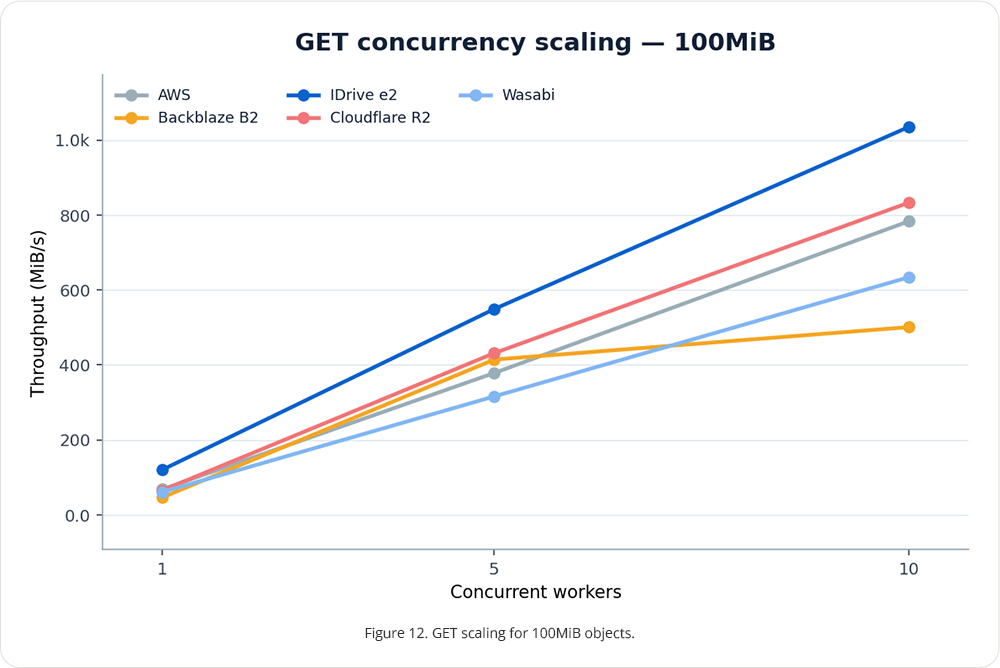
For 256KiB objects, request-processing overhead is the main factor. For 100MiB objects, sustained transfer speed and parallelism matter more. These two cases help interpret the full results. The clearer differences at higher concurrency are most relevant for restore, content delivery, and analytics workloads with many active read requests.
3. Request Latency
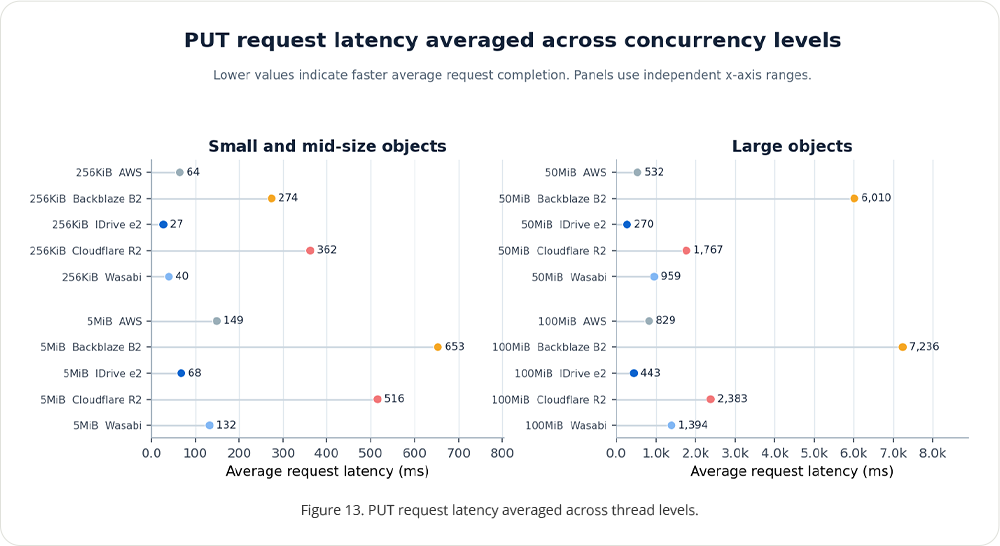
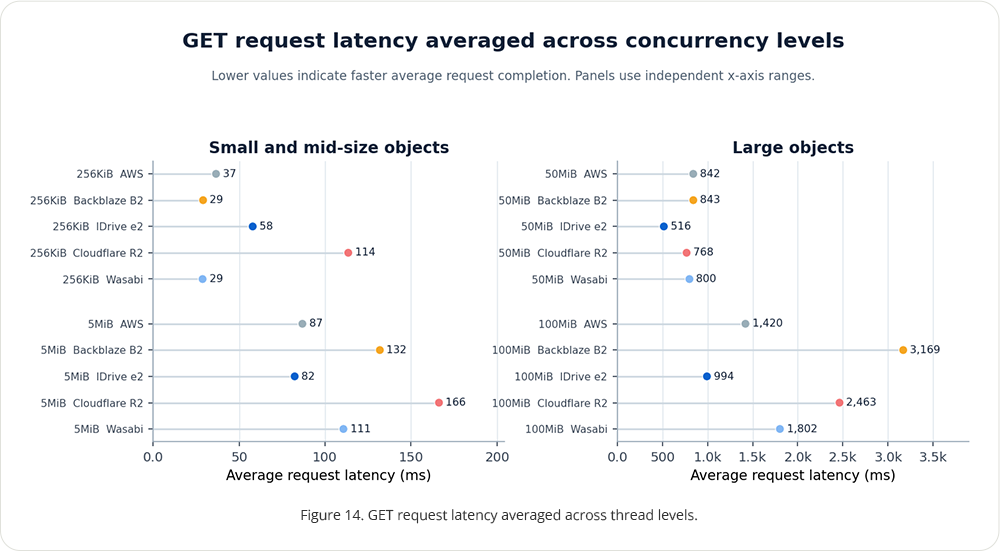
Latency is the average time it takes to complete a request, as measured by Warp. Lower latency means faster responses. It is important to look at both throughput and latency, since a provider might have high overall throughput but still take longer for each request.
The latency charts show each object size in a separate panel, so the larger 50MiB and 100MiB values don’t make the smaller-object results hard to see. Provider names stay fixed on the vertical axis, and each bar is labeled with its value. This setup helps you compare results directly, without guessing from colors or bar lengths.
4. Consistency
The coefficient of variation, or CV, shows how much the benchmark results changed from run to run compared with the average. A lower CV means the performance was more stable and predictable, while a higher CV means there was more variation between runs.
5. Workload Interpretation
5.1 Small-object workloads
The 256KiB tests focus on how well providers handle requests, reuse connections, process metadata, and manage API overhead. These results are most relevant for backup indexes, thumbnails, small app assets, and workloads with many small objects.
5.2 Mid-sized workloads
The 5MiB and 50MiB tests represent typical backup files, media segments, app bundles, and analytics files. The results show how efficient each provider is with single uploads and how much parallel uploads can boost overall speed.
5.3 Large-object workloads
The 100MiB tests focus more on steady network and service data transfer. Results with ten threads are useful for parallel backup, restore, replication, and moving data, while one-thread results show what to expect with single transfers.
5.4 Appropriate interpretation
These tests are based on results from a single client in US East. They do not cover every region, client location, network route, time of day, SDK, or app pattern. Readers should focus most on the test cases that match their own object sizes and concurrency.
6. One-Day LIST, HEAD and DELETE Benchmark
LIST, HEAD and DELETE were run as separate one-day operational benchmarks. Unlike the PUT and GET sections, these figures are not seven-cycle averages. Each test used the same US East test origin and 10 concurrent workers. LIST and DELETE used a prepared set of 100,000 objects, while HEAD used 50,000 objects as the request target. LIST and HEAD ran for approximately five minutes. DELETE continued until the fixed object set had been processed.
6.1 Test Configuration
| Operation | Objects | Object size | Concurrency | Duration |
|---|---|---|---|---|
| LIST | 100,000 | 256KiB | 10 | ~5 minutes |
| HEAD | 50,000 | Existing test objects | 10 | ~5 minutes |
| DELETE | 100,000 | 256KiB | 10 | Until completion |
For HEAD, "50,000 objects" represents the set of objects available for metadata requests. Warp completed more HEAD requests than the number of unique objects because the duration-based test continued issuing requests throughout the run.
6.2 LIST Performance
| Provider | Average objects/s | Request latency (ms) | TTFB (ms) | Median objects/s | Fastest objects/s | Slowest objects/s |
|---|---|---|---|---|---|---|
| AWS | 29,548.60 | 3,377.70 | 35.00 | 29,763.81 | 31,386.33 | 14,626.21 |
| Backblaze B2 | 41,420.09 | 2,407.00 | 24.00 | 41,297.42 | 49,517.11 | 33,347.67 |
| IDrive® e2 | 71,467.78 | 1,409.90 | 14.00 | 71,142.80 | 85,363.46 | 49,211.47 |
| Cloudflare R2 | 5,939.51 | 16,520.10 | 167.00 | 6,091.22 | 6,172.84 | 972.46 |
| Wasabi | 43,792.99 | 2,290.30 | 23.00 | 44,041.49 | 46,192.76 | 30,062.61 |
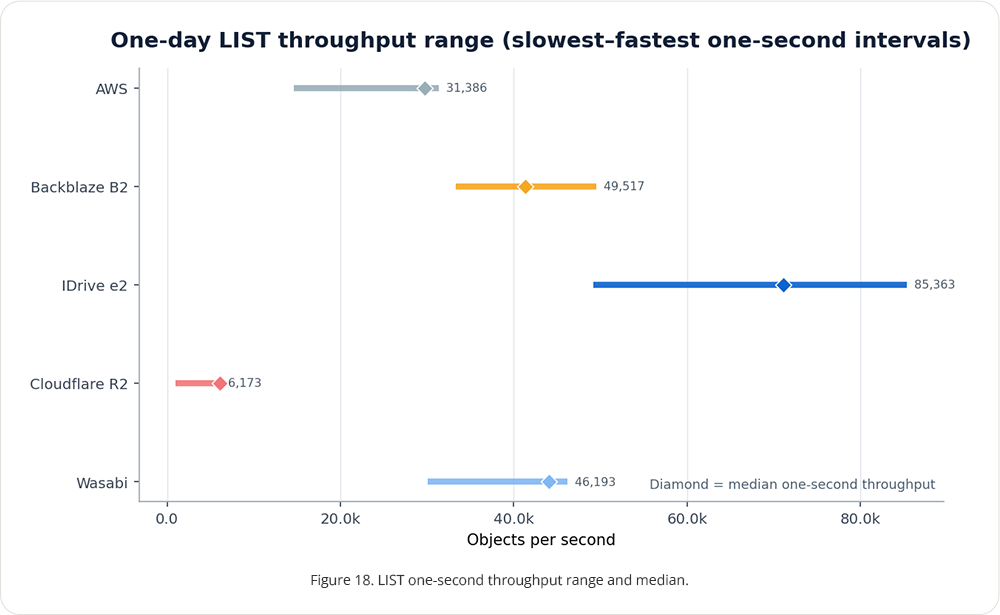
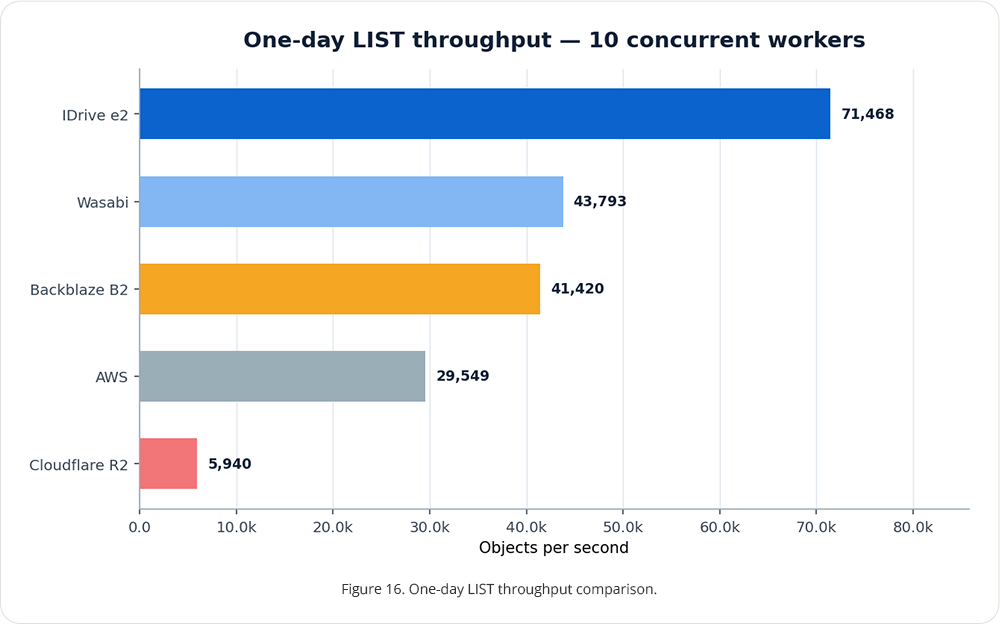
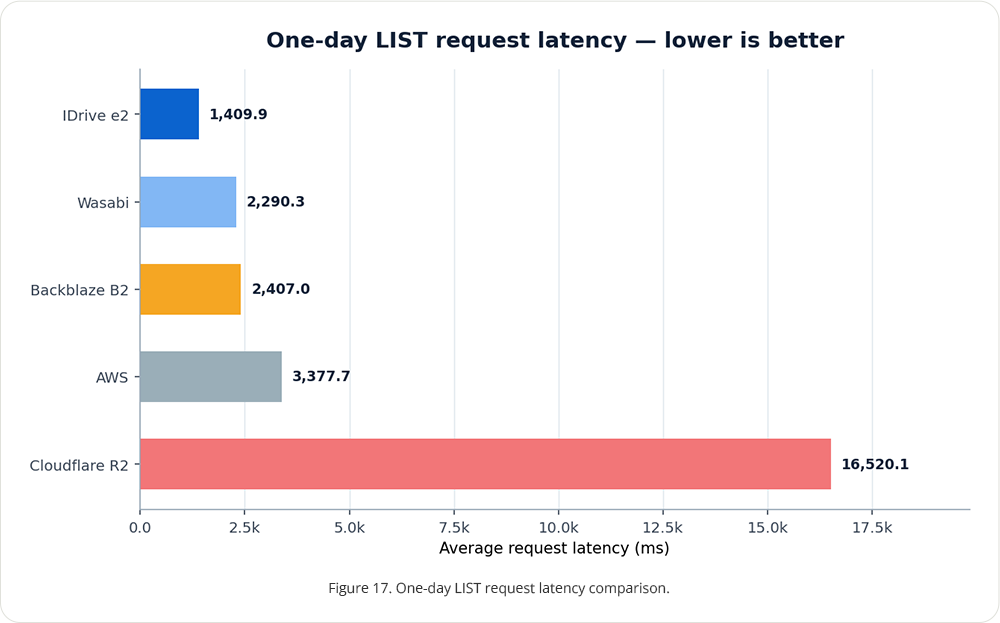
IDrive® e2 had the highest average LIST throughput at 71,467.78 objects/s and the lowest average LIST request latency at 1,409.9 ms. Its average TTFB was 14 ms. These numbers are from a single day and shouldn't be taken as long-term averages.
LIST performance depends on pagination, key traversal, response construction, and the client's ability to process each page. Throughput (objects per second) shows how fast object entries were returned, while average request latency is the time for each list request. TTFB shows how quickly the first response data arrived. Since the test was duration-based, the range chart also shows short-term variation during the run.
6.3 HEAD Performance
| Provider | Average objects/s | Request latency (ms) | Median objects/s | Fastest objects/s | Slowest objects/s | Completion time |
|---|---|---|---|---|---|---|
| AWS | 475.95 | 21.10 | 481.23 | 531.32 | 379.44 | 4m57s |
| Backblaze B2 | 770.76 | 12.90 | 784.57 | 918.04 | 501.61 | 4m57s |
| IDrive® e2 | 1,017.80 | 9.80 | 1,020.70 | 1,088.53 | 836.49 | 4m57s |
| Cloudflare R2 | 98.24 | 101.90 | 98.80 | 103.35 | 82.69 | 4m57s |
| Wasabi | 691.42 | 14.50 | 698.52 | 741.03 | 558.54 | 4m57s |
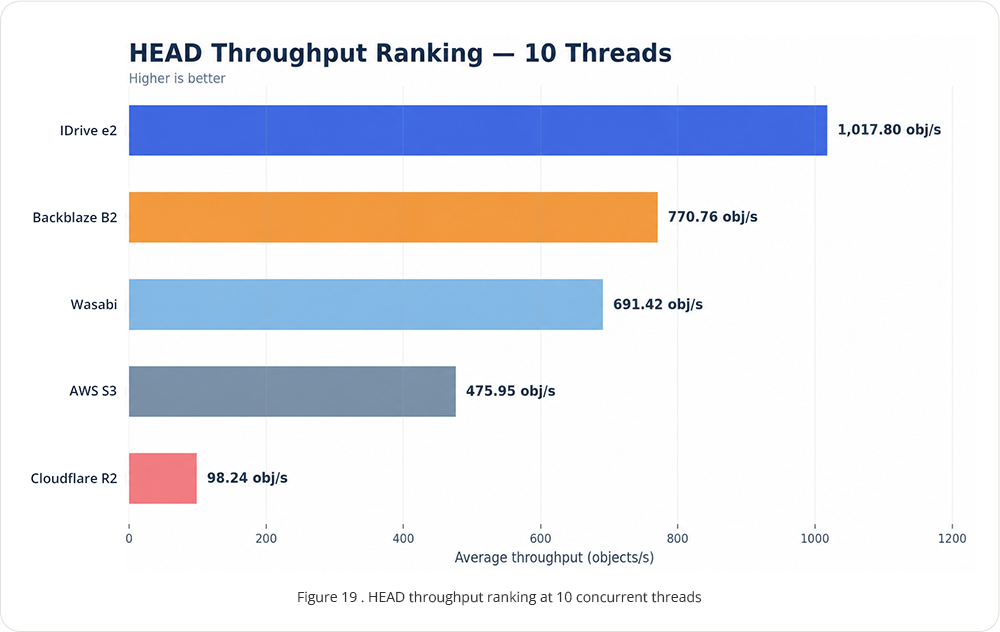
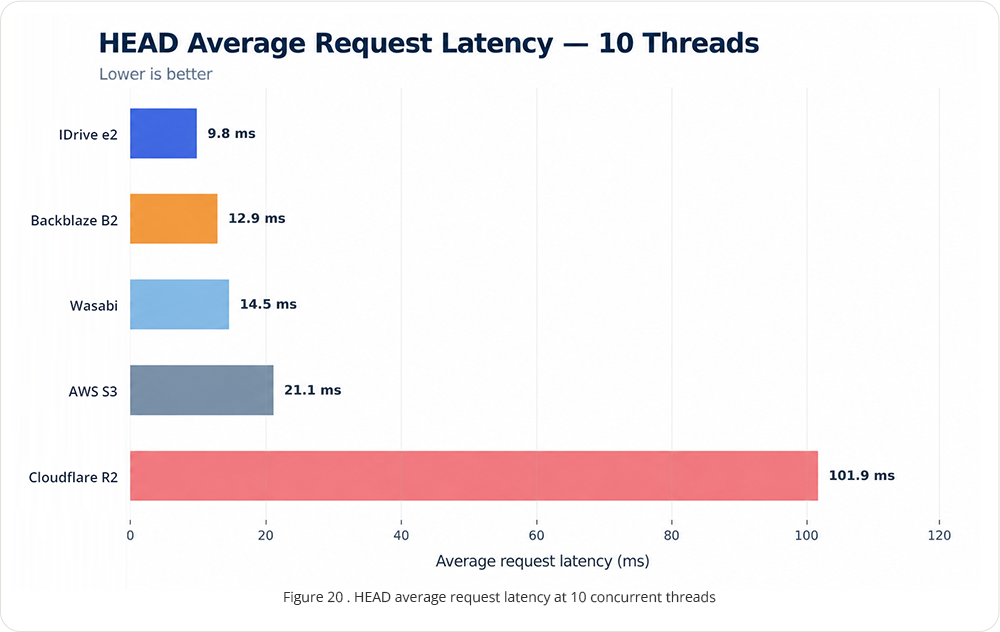
IDrive® e2 recorded the highest average HEAD throughput at 1,017.80 objects/s and the lowest average request latency at 9.8 ms. Backblaze B2 ranked second at 770.76 objects/s, followed by Wasabi at 691.42 objects/s, AWS S3 at 475.95 objects/s, and Cloudflare R2 at 98.24 objects/s. All five providers completed the test without reported errors.
6.4 DELETE Performance
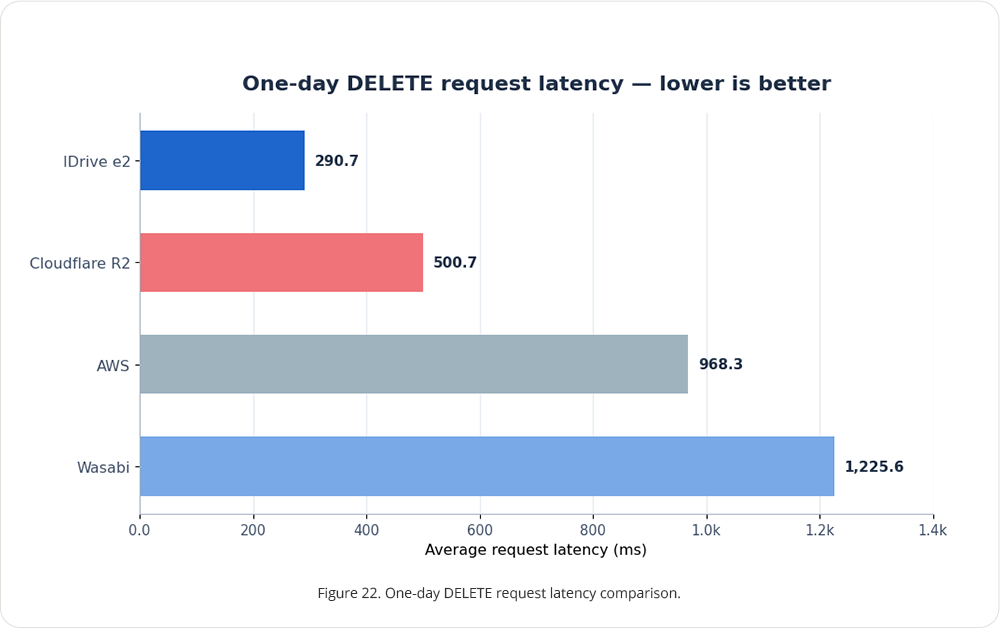
| Provider | Average objects/s | Request latency (ms) | Median objects/s | Fastest objects/s | Slowest objects/s | Completion time |
|---|---|---|---|---|---|---|
| AWS | 1,032.09 | 967.98 | 1,038.56 | 1,128.34 | 818.56 | 1m37s |
| IDrive® e2 | 3,475.88 | 290.43 | 3,560.97 | 4,366.62 | 2,069.22 | 29s |
| Cloudflare R2 | 2,022.16 | 495.89 | 2,023.71 | 2,118.75 | 1,912.33 | 50s |
| Wasabi | 815.72 | 1,226.08 | 817.09 | 834.96 | 779.91 | 2m03s |
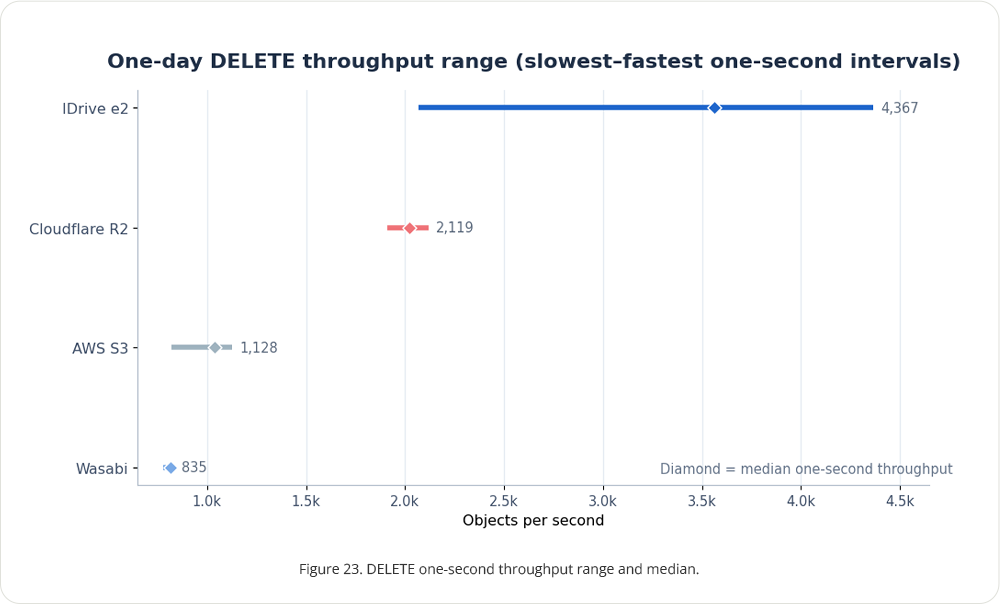
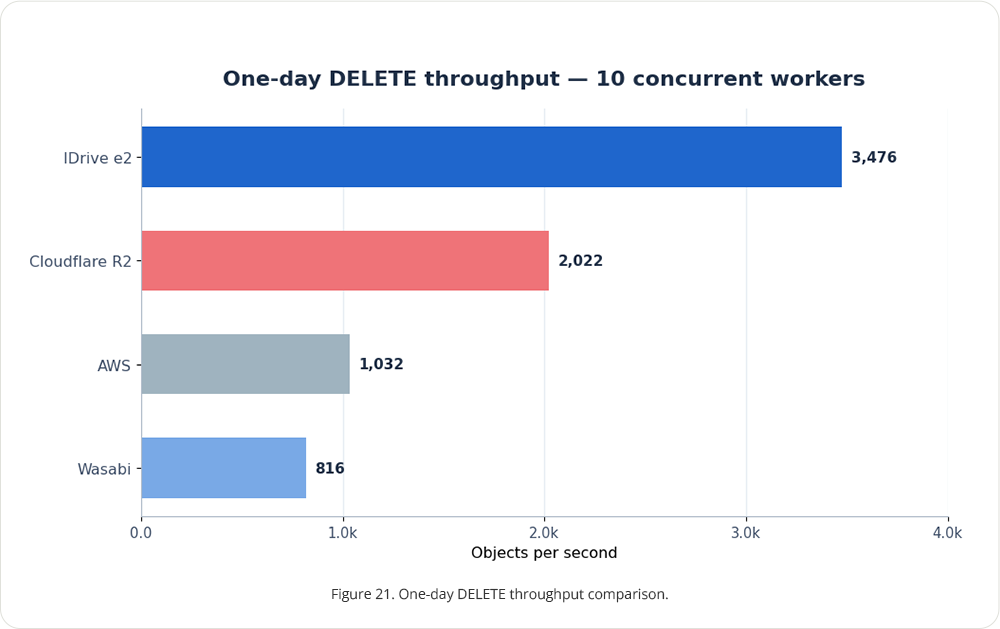
IDrive® e2 achieved the highest comparable DELETE throughput at 3,475.88 objects/s and the lowest average request latency at 290.43 ms. Cloudflare R2 ranked second with an average throughput of 2,022.16 objects/s and latency of 495.89 ms, followed by AWS S3 at 1,032.09 objects/s and Wasabi at 815.72 objects/s.
Note: Backblaze B2 was excluded from the DELETE comparison because B2 buckets are inherently versioned and do not support a conventional non-versioned mode. Warp's standard DELETE benchmark issues name-based DELETE requests without enumerating and deleting individual version IDs. On B2, such requests create delete markers rather than permanently removing the stored object versions, making its results unsuitable for a direct comparison with non-versioned DELETE operations.
6.5 LIST/HEAD/DELETE Caveats
- This is a one-day comparison and does not show day-to-day consistency.
- LIST and HEAD are duration-based tests, while DELETE completes after the fixed object set has been processed. Their throughput and completion behavior should therefore be interpreted separately.
- Provider-side pagination, listing implementation, delete batching, throttling, and bucket configuration can materially affect results.
- These figures are an operational snapshot for the tested setup and are separate from the seven-cycle PUT/GET results.
7. Methodology and Quality Controls
7.1 Seven-cycle PUT and GET benchmark
The benchmark used Warp from one Vultr Linux VM in US East. Each provider received the same combinations of operations, object sizes, concurrency, and durations. The matrix comprised 24 workload configurations per provider per cycle: two operations, four object sizes, and three thread levels. Each workload ran for five minutes.
Each test cycle preserved the same workload dimensions so that day-to-day results could be aggregated on a like-for-like basis. PUT and GET were evaluated independently at 256KiB, 5MiB, 50MiB, and 100MiB using 1, 5, and 10 concurrent workers. Every workload ran for five minutes. This design produces both sequential and parallel observations without combining fundamentally different object sizes or concurrency levels into a single score.
7.2 Valid-result criteria
A run-level result was included when Warp produced a complete final report containing a valid numeric throughput measurement. A non-zero wrapper exit code or wrapper timeout did not automatically invalidate the result when Warp had already completed the benchmark and produced usable final statistics. Runs were excluded when no complete numeric final result was available, including failures during test preparation, service-unavailable errors, and DNS or network timeouts that prevented benchmark execution.
7.3 Aggregation
For each provider-workload cell, the report calculates the arithmetic mean of valid run-level throughput values. Sample counts vary where results were excluded. Latency figures are derived from the valid results for the same workload cells.
No missing result is converted to zero because doing so would mix performance with test completion and artificially reduce the average. Instead, excluded results remain visible in the sample count and availability reporting. The seven-cycle matrices in the appendices preserve the run-level view, allowing readers to see the individual observations behind the summarized tables and charts.
Nine incomplete runs were identified across Wasabi and Backblaze B2. Three Wasabi PUT tests reached the warp timeout, five Backblaze B2 GET tests failed because the service was unavailable during test preparation, and one Backblaze B2 PUT test failed because of a DNS lookup/I/O timeout.
7.4 One-day LIST,HEAD and DELETE benchmark
LIST, HEAD, and DELETE used the same provider set, US East test origin, and 10-worker concurrency level, but their execution designs differed. LIST and HEAD were duration-based tests that ran for approximately five minutes. DELETE processed a fixed object set and ended when that set had been completed. Their results are presented independently and are not combined with the seven-cycle PUT and GET averages or used to create an overall provider score.
7.5 Units
- PUT and GET throughput: MiB/s.
- LIST, HEAD, and DELETE throughput: objects/s.
- Request latency and TTFB: milliseconds.
7.6 Full Benchmark Logs
For reproducibility and independent review, the complete Warp run logs and supporting benchmark artifacts are referenced in the public repository below:
Full Warp benchmark logs: https://github.com/e2-idrive/s3-benchmark-logs
The repository provides the run-level material used to validate the reported aggregates, investigate excluded or failed runs, and reproduce the calculations described in this report.
8. Limitations
- Single client location and network path; results may differ across regions, ISPs, clouds, or enterprise networks.
- Synthetic workloads: Warp provides repeatability but does not reproduce every application's request mix, SDK behavior, retries, or object-key distribution.
- Limited observation period: PUT and GET span seven cycles; LIST, HEAD and DELETE are one-day snapshots.
- No cost, durability, feature, support, or egress analysis: this report is performance-focused.
- No percentile-latency comparison across all charts: averages are shown for readability; applications sensitive to tail latency should conduct workload-specific P95/P99 testing.
- Excluded results: averages are based on valid samples and may have unequal sample counts across providers and workload cells.
What the Results Show
In this US East test, IDrive® e2 led in average PUT workloads and in 9 out of 12 average GET workloads. Backblaze B2 led the 1-thread GET at 5MiB and 50MiB, and the 5-thread GET at 5MiB. The one-day operational tests are separate from these seven-cycle results.
This report does not create a single score for each provider. Different applications care about different things, like upload, download, listing, deletion, object size, concurrency, latency, consistency, location, and cost. The best way to use these results is to pick the operation and workload that match your needs, then compare both the average and the detailed run-level data.